MANHATTAN ASSOCIATES (MANH)·Q4 2025 Earnings Summary
Manhattan Associates Beats Q4, But FY26 EPS Guidance Disappoints—Stock Drops 4%
January 27, 2026 · by Fintool AI Agent
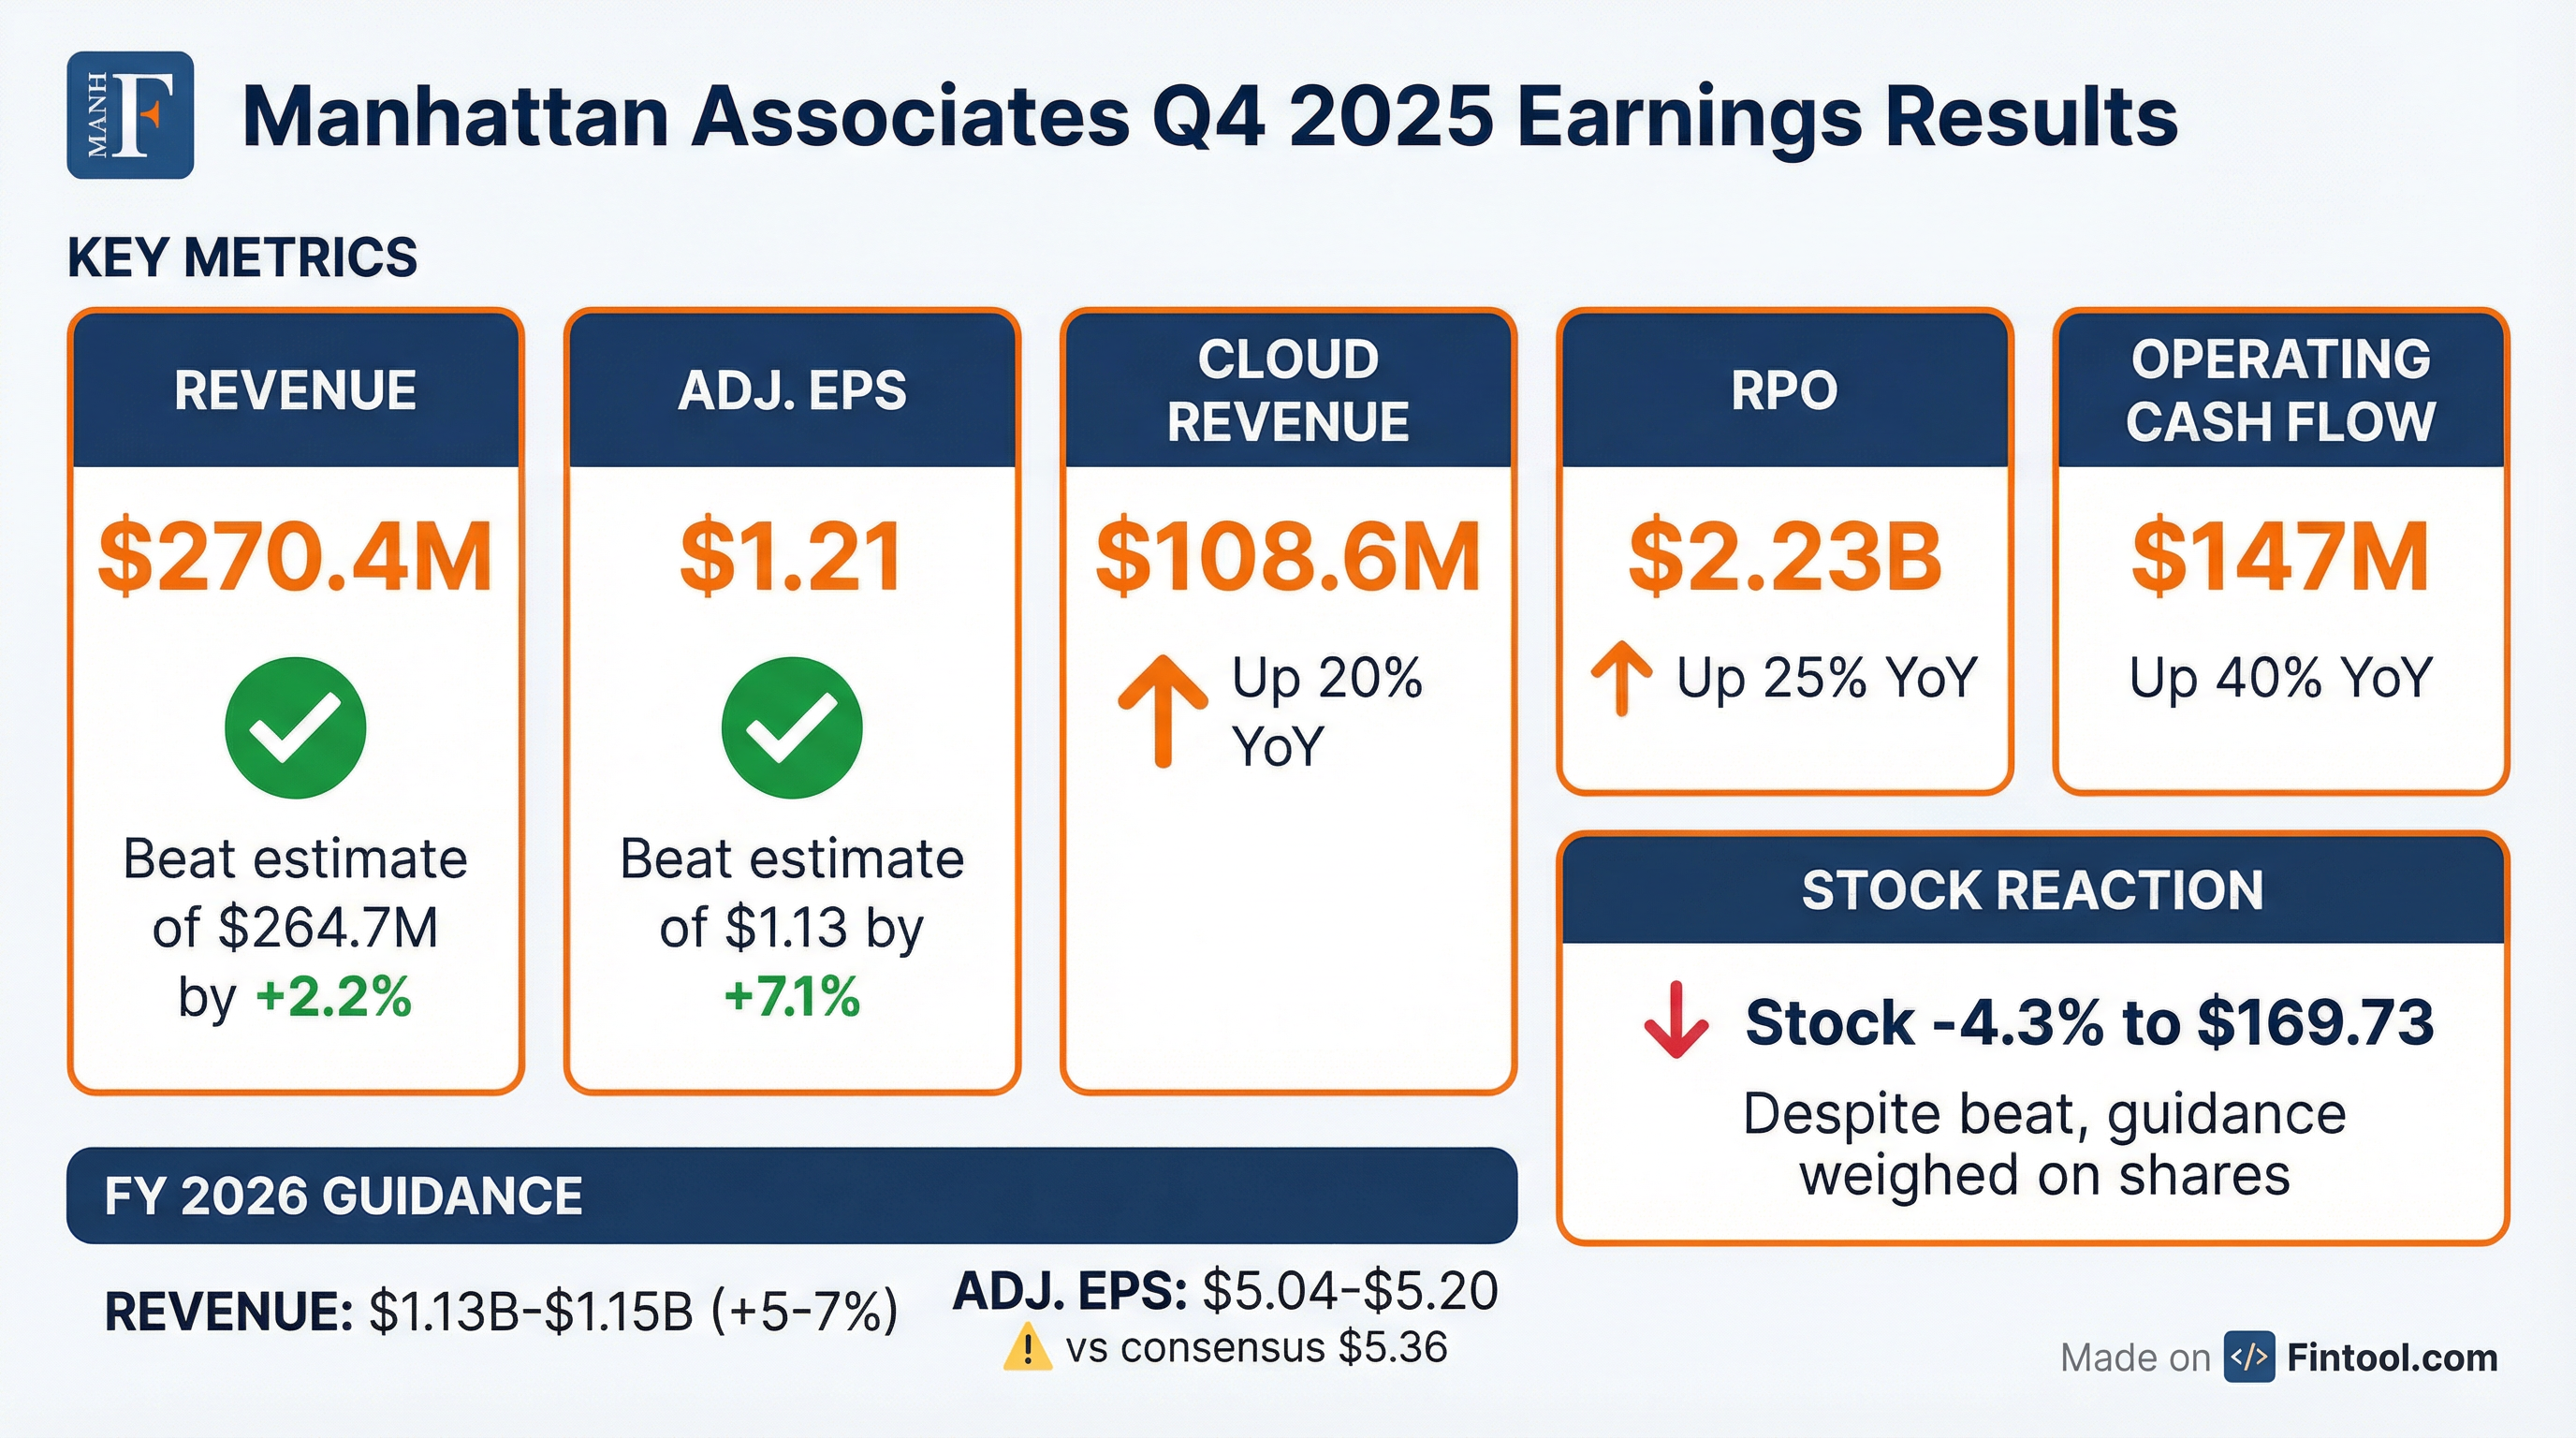
Manhattan Associates (MANH) delivered another earnings beat in Q4 2025, extending its streak to eight consecutive quarters, but the stock fell 4.3% after the company issued FY2026 EPS guidance well below Wall Street expectations. Revenue of $270.4M topped the $264.7M consensus by 2.2%, while adjusted EPS of $1.21 beat the $1.13 estimate by 7.1%.
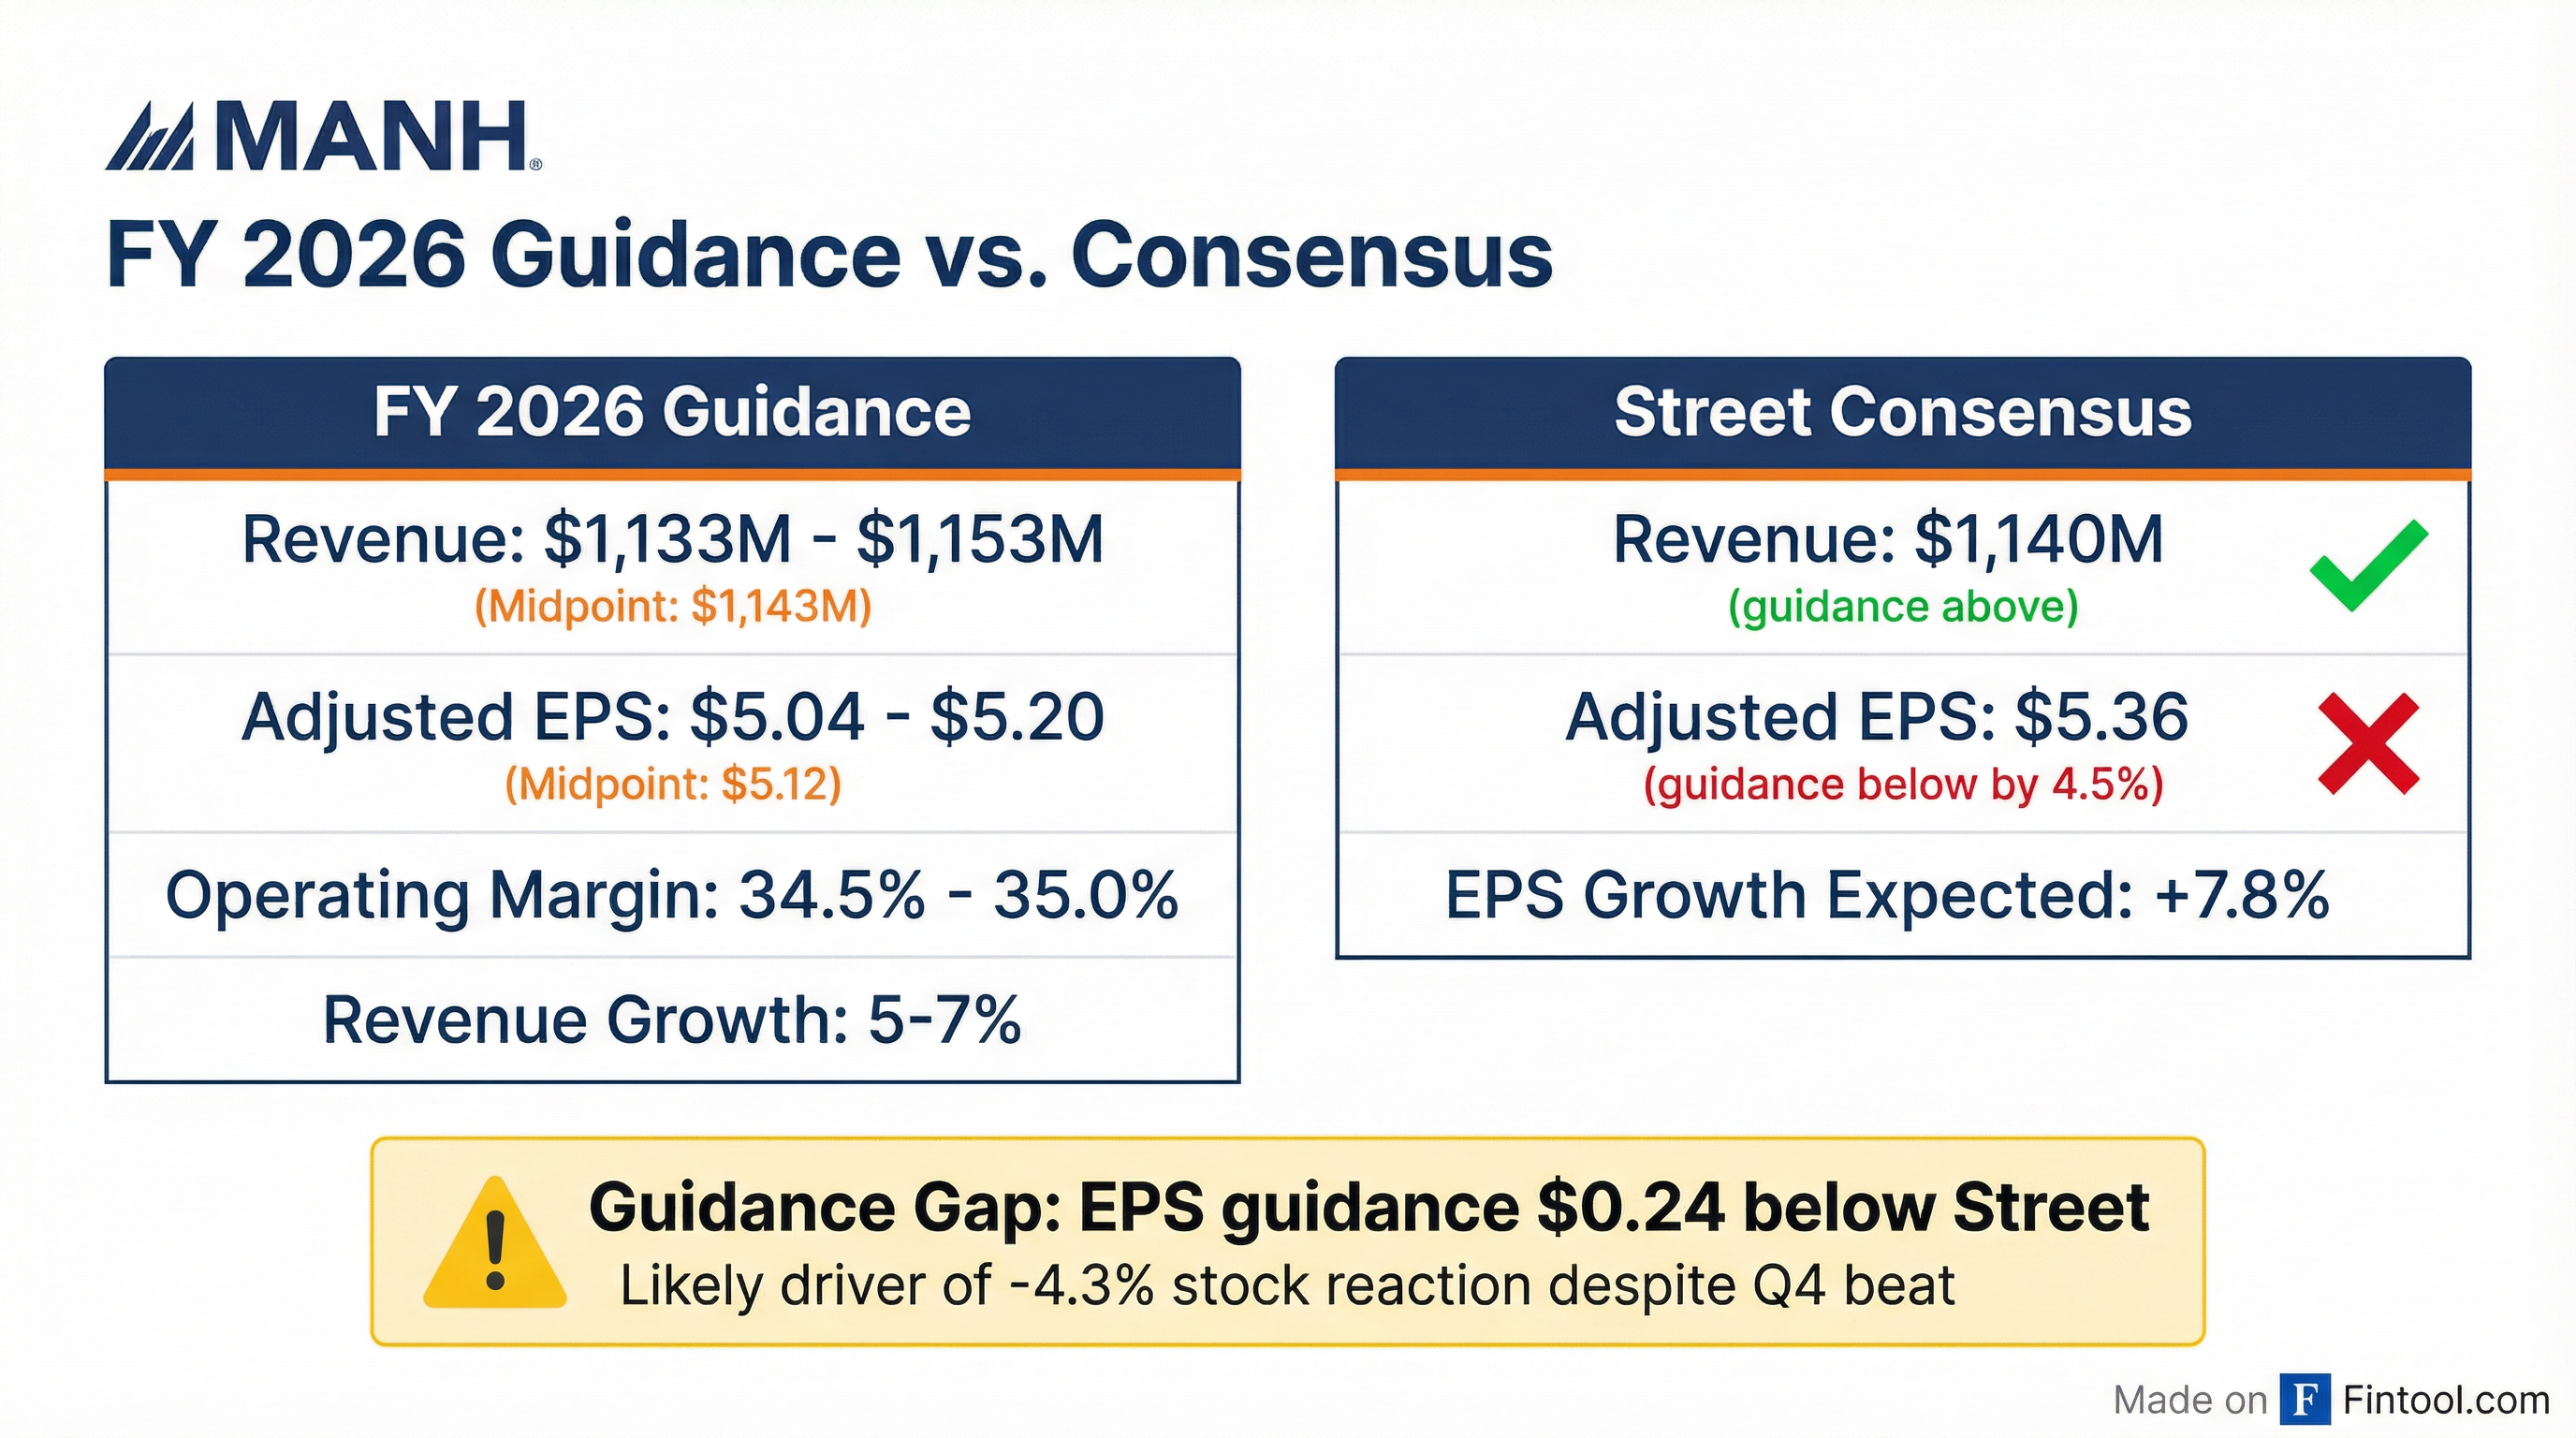
The disconnect between the Q4 beat and the stock decline centers on one issue: FY2026 adjusted EPS guidance of $5.04-$5.20 came in 4.5% below the $5.36 Street consensus, signaling that the margin tailwinds investors had counted on may not materialize.
Did Manhattan Associates Beat Earnings?
Yes—and convincingly. Q4 2025 marked Manhattan Associates' eighth consecutive quarter of beating EPS estimates, with consistent double-digit surprise rates.
Data: Company filings , consensus estimates
The company's beat streak is remarkable:
Data:
What Did Management Guide?
This is where the story turns. While Q4 results exceeded expectations, FY2026 guidance disappointed on the EPS line.
Data: , consensus
Quarterly Guidance Breakdown (FY2026):
Q1 starts light on margins due to increased investment in sales, marketing, and the ~100 new services hires in January. Margins expand through the year as revenue scales.
The $0.24/share guidance gap ($5.12 midpoint vs. $5.36 consensus) was the primary driver of the 4.3% stock decline.
CEO Eric Clark framed the outlook positively, noting that Q4 bookings beat full-year guidance by $40M—more than just timing catch-up from Q3's shortfall:
"We beat our full-year guidance by $40 million. So, it absolutely was more than just timing by quarter. It was overperformance by the team."
However, the guidance implies:
- GAAP EPS declining 2-6% YoY ($3.37-$3.53 vs. $3.60 in FY25) due to elevated stock-based compensation
- Adjusted EPS flat to up 3% ($5.04-$5.20 vs. $5.06 in FY25), well below the +7.8% growth Street was modeling
How Did the Stock React?
The after-hours recovery to $175.20 suggests some investors view the selloff as overdone, but the stock remains 43% below its 52-week high.
Historical post-earnings moves:
Data:
The pattern is clear: Manhattan Associates has consistently beaten estimates, but the stock has reacted negatively when guidance or forward metrics disappoint.
What Changed From Last Quarter?
Improving
Cloud momentum accelerating: Cloud subscription revenue grew 20% YoY to $408.1M for FY2025, with Q4 cloud bookings hitting a record. New logos represented 55% of 2025 cloud bookings—well above the typical one-third mix—with Q4 even stronger at 75%+ from new logos. Win rates remained above 70%.
Q4 notable wins included:
- Fortune 100 home improvement company → new Active Warehouse customer
- Upscale department store chain → new Active Omni + Active Warehouse
- Largest global provider of medical surgical products → new Active Warehouse
- Medical supplies/equipment company → new Active Supply Chain Planning
- Home furnishing wholesaler → new Active Transportation + Active Warehouse
RPO strength: Remaining Performance Obligations hit $2.23B at year-end, up 25% from $1.78B a year ago. This backlog provides strong visibility into future revenue.
Data:
NEW: Ramped ARR disclosure: Management introduced a new metric—four-year annualized recurring revenue—to better showcase cloud growth. Ramped ARR exceeded $600M at year-end, up 23% YoY. This metric assumes renewals at current pricing with no churn, providing clarity on the pace of cloud revenue realization over time.
Cash generation: Operating cash flow of $147M in Q4 (up 40% YoY) and $389.5M for FY2025 (up 32% YoY) fund aggressive buybacks.
Pressuring
Services revenue decline: Services revenue fell to $503M in FY2025 from $525.5M in FY2024, a -4.3% decline as customers shift from implementation to cloud subscriptions.
License revenue fading: Software license revenue of $14.8M in FY2025 (vs. $15.1M) reflects the continued transition away from perpetual licenses.
Stock-based compensation headwind: SBC of $111.3M in FY2025 (10.3% of revenue) creates a meaningful GAAP vs. non-GAAP gap. FY2026 guidance implies SBC rising to 10.3-10.4% of revenue.
Key Segment Performance
Revenue Mix Shift Continues
Data:
Cloud now represents over 40% of quarterly revenue, up from 35% a year ago. The mix shift is positive for recurring revenue quality but creates near-term margin pressure.
Geographic Performance
Data:
International markets drove most of the growth, with EMEA up 13% and APAC up 12%, while Americas grew just 1%.
Capital Allocation
Manhattan Associates continues to aggressively return capital to shareholders through buybacks:
*Data: *
The company repurchased 2.4% of shares outstanding in FY2025 at prices well above the current $170 level. The new $100M authorization signals continued commitment to buybacks.
Balance sheet remains strong:
- Cash: $328.7M (up from $266.2M)
- No debt
- Days Sales Outstanding: 73 days (unchanged)
Management Credibility Check
Data: Company filings,
Management has consistently delivered at or above the high end of guidance. The FY2026 EPS guidance reset, while disappointing versus Street expectations, likely reflects a prudent approach given macro uncertainty.
Leadership updates for 2026: CEO Clark's first full year saw significant go-to-market investments:
- Katie Foote hired as CMO (ex-Salesforce/CaptivateIQ) — started at NRF in January
- Greg Betts as COO — leading updated partner program for global SIs and tech partners
- Bob Howell as Chief Sales Officer — reorganized entire global sales team under his leadership
What Analysts Are Saying
Data: ,
Morgan Stanley flagged two "underappreciated headwinds": contract drainage as deals approach renewal, and a weaker OMS renewal cohort in 2026.
Q&A Highlights
AI Agent Monetization Strategy
CEO Eric Clark outlined the commercialization approach for Manhattan's new Agentic AI products:
"We're starting with proof of concepts or pilots with our customers. We're offering this at a very low-cost, low-risk scenario. It's a 90-day proof of concept... Those forward-deployed engineers will also help them build at least one or two custom agents using our agent foundry and train them how to build their own custom agents."
The monetization model uses a standard uplift pricing approach—similar to existing add-ons like labor and slotting—making it easy for salespeople to sell and customers to buy.
Active Store with Embedded AI: At NRF, Manhattan showcased its Active Point of Sale application—mobile-first and cloud-native—now embedding agentic AI to help store associates become more effective sellers. The store associate agent provides prescriptive recommendations within the POS application, informed by real-time sales performance across the network and a true view of commerce activity (for customers also using Active OMS).
New: Fulfillment Optimization Simulation: This quarter, Manhattan released a simulation capability for Active OMS customers to experiment with optimization settings—testing strategies for speed-focused holiday fulfillment vs. inventory-clearing end-of-season approaches. Management projects strong cross-sell potential similar to Interactive Inventory.
Critical point: Management confirmed that AI agent revenue is incremental to guidance—not baked into the FY2026 outlook.
Services Outlook: Mid-Single-Digit Growth Expected
Clark addressed the frequent investor question about services sustainability:
"I think what's unique about our services business is that it is so domain-specific. And that gives us a unique advantage across our products, but also when we're talking about things like agentic AI... We don't expect this to be a double-digit growth rate, and we don't necessarily want it to be. Our focus is on growing the cloud business double-digit, 20%+."
The company has already hired ~100 new services associates in January 2026—a stark contrast to a year ago, signaling confidence in the pipeline:
"That's a big difference from where we were a year ago in January. I think that says a lot about the confidence level we have in the book of business that we've built around services."
Renewal Strategy: Flexibility on Duration
CFO Dennis Story explained the 18-20% renewal contribution to FY2026 RPO guidance:
"If we really held ourselves to make sure that we renew every deal at five years, that 18%-20% could be higher, and the total RPO growth year-over-year could be higher. But we think we've got a very sticky product, and our customers are not leaving us."
Management prefers 3-year renewals over 5-year terms to enable more frequent pricing conversations. GRR (gross retention rates) described as "world-class."
CIO Sentiment Stable
When asked about enterprise spending appetite, Clark noted demand hasn't materially shifted:
"The sentiment really hasn't changed drastically over the past 6 to 9 months... There's not another provider in the market that can provide what we can in these spaces. That's why we continue to see these very, very strong win rates against the competition."
Conversion Programs Bearing Fruit
The on-premise to cloud conversion initiative launched mid-2025 is now generating pipeline:
"We started that effort kind of mid-year in 2025, and we saw some early success. We're now seeing, I would say, the fruits of that effort, and we're seeing the pipeline really start to build. We've already closed some of these deals in Q1."
Many conversions are being closed as fixed-fee, fixed-timeline deals, reflecting confidence in implementation velocity.
Forward Catalysts
Positive:
- AI agents launch: Commercially available with Agent Foundry for custom agents—incremental to guidance
- RPO backlog of $2.23B provides 2+ years of revenue visibility
- Expanded go-to-market: 100 new services hires in January, new CMO Katie Foote (ex-Salesforce), COO Greg Betts
- Conversion pipeline building—fixed-fee deals closing in Q1
- Strong cash generation supports continued buybacks
Risks:
- FY2026 EPS guidance implies near-zero earnings growth
- Services revenue erosion as cloud transition continues
- Macro uncertainty impacting enterprise spending
- High stock-based compensation diluting GAAP earnings
- Customer liquidation created $1.3M Q4 headwind ($2.5M annualized)
The Bottom Line
Manhattan Associates delivered another solid operating quarter—beating on revenue, EPS, cloud growth, and cash flow—but the stock sold off on FY2026 guidance that implies minimal earnings growth. The $0.24 EPS gap versus consensus ($5.12 midpoint vs. $5.36) overshadowed the Q4 beat.
Bull case: The 25% RPO growth, accelerating cloud transition, and record bookings suggest the business is healthy. The guidance may prove conservative, as it has historically.
Bear case: Near-zero EPS growth in FY2026, declining services revenue, and elevated SBC suggest margin expansion has stalled. At 33x forward P/E (on $5.12 guidance), the stock isn't cheap for low-single-digit growth.
The after-hours bounce to $175 suggests the market may be recalibrating, but investors will need to see evidence that FY2026 guidance is beatable before the stock can recover to prior highs.
View MANH company profile | Read Q4 2025 transcript | View Q3 2025 earnings